First of its kind measure of the social progress impact of climate change. By Measuring CO2 emissions per capita, material consumption per capita, and biodiversity, we see that the countries that perform well on the Just Transition Score have more sustainable social progress.

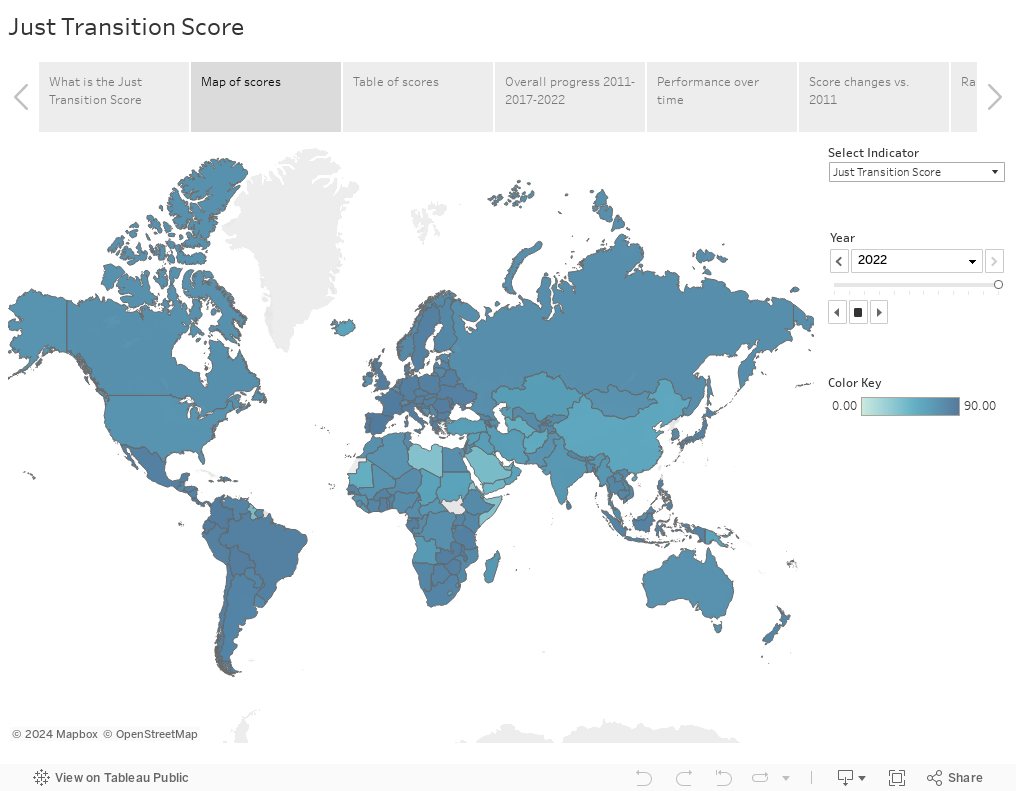
The world needs progress that is sustainable and inclusive. A ‘Just Transition’ means advancing equitable human progress while reducing damage to the environment. Human progress that is not sustainable is empty and doomed to fail. The Just Transition Score measures how 161 countries are progressing against these goals, using the Social Progress Index rather than GDP as a measure of human progress and CO2 emissions per capita, material consumption per capita, and biodiversity as measures of sustainability.

A high Just Transition Score means that a country is achieving higher social progress and biodiversity protection with lower CO2 emissions and material footprint. A low Just Transition Score means that a country is achieving lower social progress and biodiversity protection with higher CO2 emissions and material footprint. Our premium access includes data like the Just Transition Score, Carbon Efficiency and Material Efficiency of Social Progress indicators.
Although all G7 countries have improved since 2011 in the Just Transition Score, we see that the United States and Canada are lagging behind. The US and Canada are the G7 countries with highest CO2 emissions per capita in 2022.
Get these features with your premium access:
The best part? Experience the SPI Platform’s intuitive design, offering easy navigation through rich visualizations.
Plus, access the full dataset for a comprehensive exploration. Should you need assistance, our support team is always ready to help!

The Social Progress Index framework assesses 50+ indicators covering three key dimensions: Basic Human Needs, Foundations of Wellbeing, and Opportunity. This comprehensive approach goes beyond GDP, providing stakeholders with the insights needed to identify improvement areas and implement targeted actions for enhanced social wellbeing. Read the Methodology of the Just Transition Score which includes a comparison with environmental sustainability indicators or learn more about the Social Progress Index.
.png)