🔥 NEW exclusive visualizations for the  Global Social Progress Index  🔥  

Social Progress Index for the U.S. Metropolitan Areas

The Social Progress Index for all 384 metropolitan areas was built in collaboration between the Initiative for a Competitive Inner City and the Social Progress Imperative. The index measures how the metropolitan areas have advanced or regressed in social progress for 2018 and 2023.
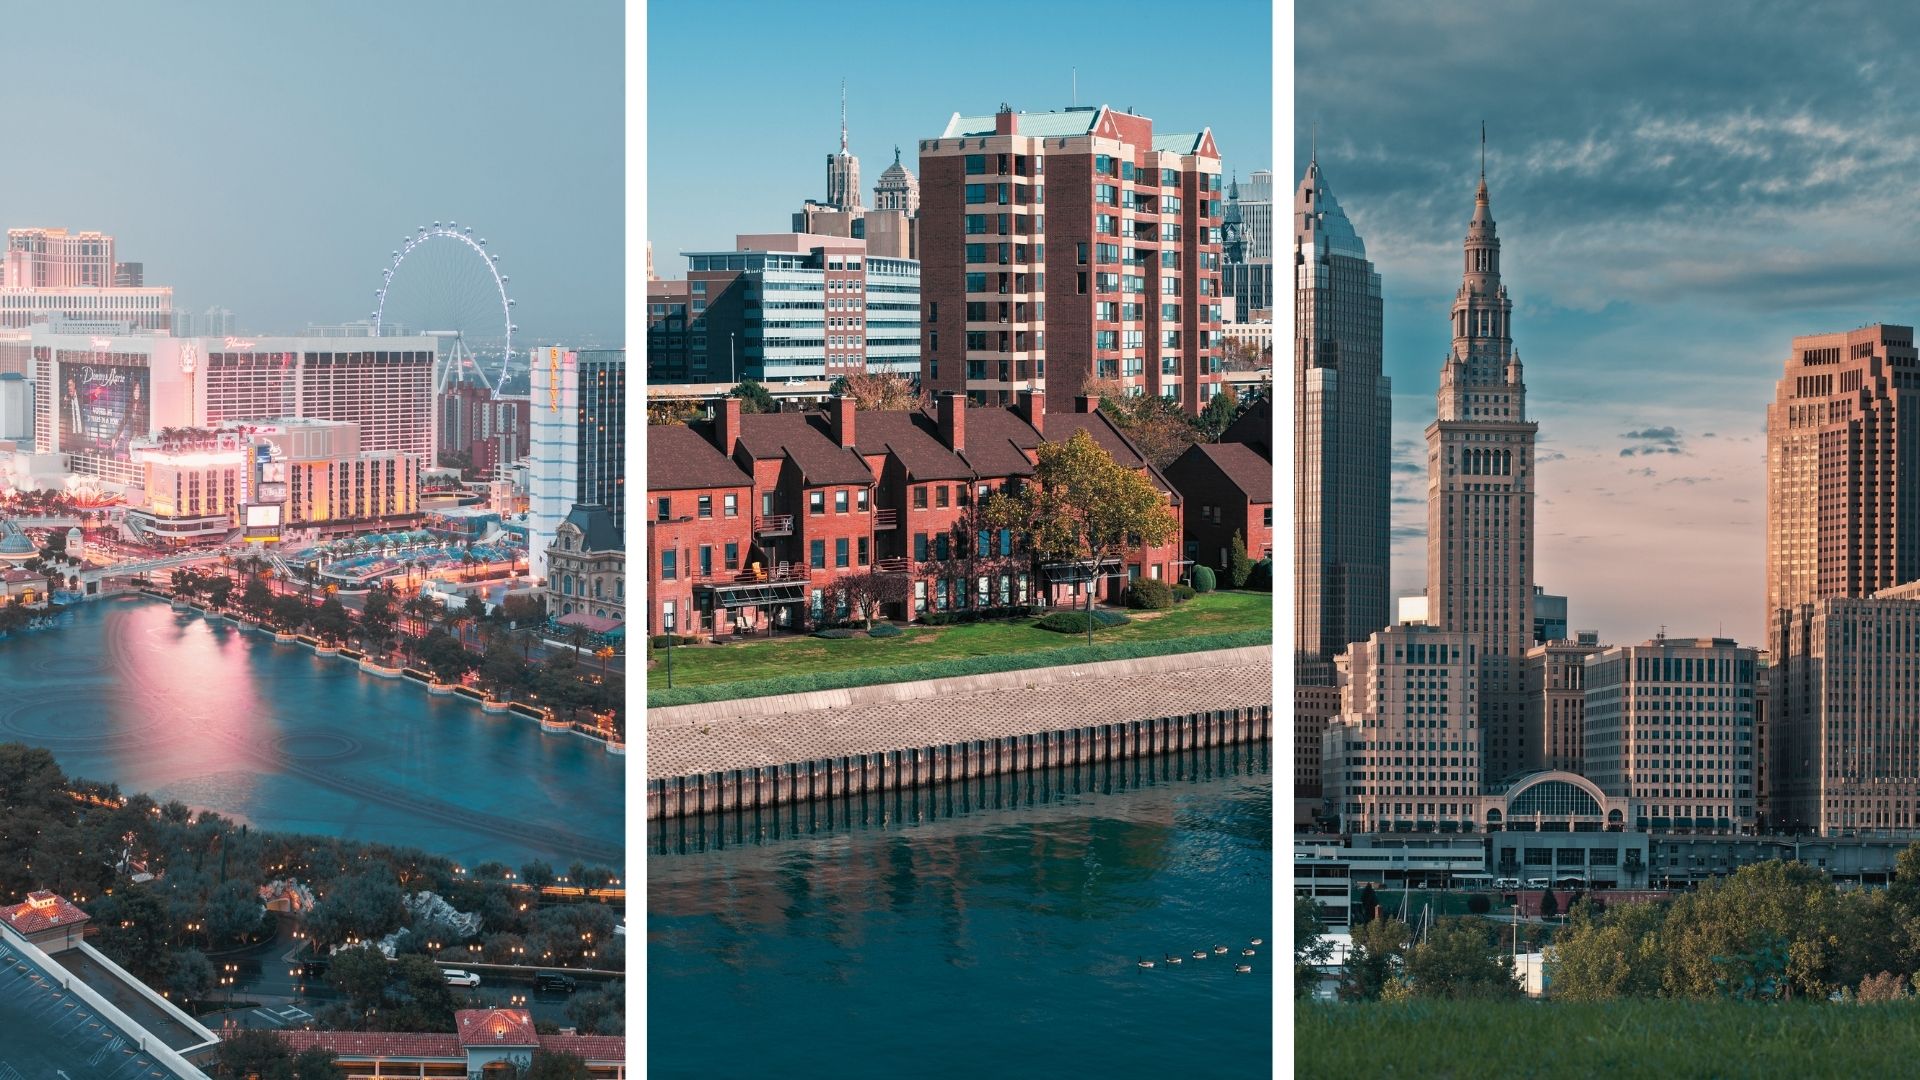
Download for free
Overall, social progress declined in the metropolitan areas between 2018 and 2023.
The Initiative for a Competitive Inner City and the Social Progress Imperative are conducting metropolitan-level research on the alignment between economic development goals and improvements in overall well-being in U.S. metropolitan areas.
Approach
Using ordinary least square regressions, we explored the relationship between conventional economic development indicators (i.e., job growth, number of strong clusters) and changes in the Social Progress Index.

We explored both single variable models as well as grouping of conventional economic indicators, with controls for population, initial Social Progress Index level, and initial indicator level.
Next Steps
We will use these models to identify metros that over-performed and under-performed relative to expectations, which we will further explore in case studies.

Preliminary Findings

Social progress decreased in 90% of the nation’s 384 metros. Among metropolitan areas with populations of at least 1 million, social progress improved only in Las Vegas, Buffalo, and Cleveland and declined by the largest percentages in Riverside, San Francisco, and Sacramento.

Overall, conventional economic development indicators do not predict the social progress index very well.
‍
Our models explained less than one percent of the variation of log change of social progress from the mean.
‍
Of the single variable explanatory models we tested, number of strong clusters with a control for 2018 population was the only conventional economic indicator in which an increase in the indicator was associated with an increase in social progress and the overall model was significant at the ten percent level. In this model, an additional strong cluster is associated with a 10% increase in social progress. Increases in all other conventional economic indicators were associated with decreases in social progress or the overall model was not significant at the ten percent level.
‍

Download the dataset

The calculations include the full framework, and scores for the 384 metropolitan areas by dimension and indicator for 2018 and 2023.  

Social Progress Index Framework for Metropolitan Areas

Full dataset and framework available at download

COMPONENTS

INDICATORS

COMPONENTS

Data sources: CDC 500 Cities & PLACES, USDA Food Environment, EPA EJScreen, Federal Emergency Management Agency – NRI, American Community Survey, National Highway Traffic System, Decennial Census.

Notes on methodology: Our partners at the Social Progress Imperative used factor analysis to create scores for each individual bucket, so not all component variables are weighted equally, but are rather based on a factor analysis algorithm. All variables are scaled so that positive outcomes are in the same direction.

Conventional Economic Development Indicators
All growth rates are between 2018 and 2023: Job growth rate, Per capita income growth rate, Number of strong (1) clusters (2), Percent high-tech (3) employment, High-tech (4) employment growth, Percent creative class (5) employment, Creative class (6) employment growth.

1. Clusters with a location quotient greater than 1 are defined as “strong”. This cutoff is common in regional research literature (Cortright 2006).
2. Clusters are defined using standardized definitions from the U.S. Cluster Mapping Project.
3,4. High-tech industries are industries with high-technology occupation concentration at least twice the national average (Hecker 2005).
5,6. Creative class occupations include a wide range of occupations such as science, arts, and healthcare occupations (Florida 2002).

‍