The Brazil Social Progress Index covers 5,570 municipalities across Brazil's 26 states and the Federal District. It is one of the most ambitious efforts worldwide to measure social progress on a subnational scale.
The Brazil Social Progress Index provides a unique view into the state of social progress across Brazil, offering both decisionmakers and citizens a powerful tool to identify and advocate for priority areas of intervention. By following the proven methodology of the Social Progress Index, the Brazilian index measures 57 indicators sourced from reputable public data and leading research institutions. You can explore the results for 5,570 municipalities, 26 states and the Federal District for areas such as environmental quality, housing, education, rights and voice and more.
The 2026 Index is the third edition and has been updated annually since 2024 becoming the leading data insights tool for tracking social and environmental progress in Brazil.


While Brazil shows improvement across all social progress dimensions from 2024 to 2026, there is still a disparity. The Opportunity dimension lags at 46.82 points, a difference of 27.76 points compared to the country's performance in meeting Basic Needs.
Explore the full rankings, report, and interactive map to better understand where Brazil is making progress and where urgent action is needed.
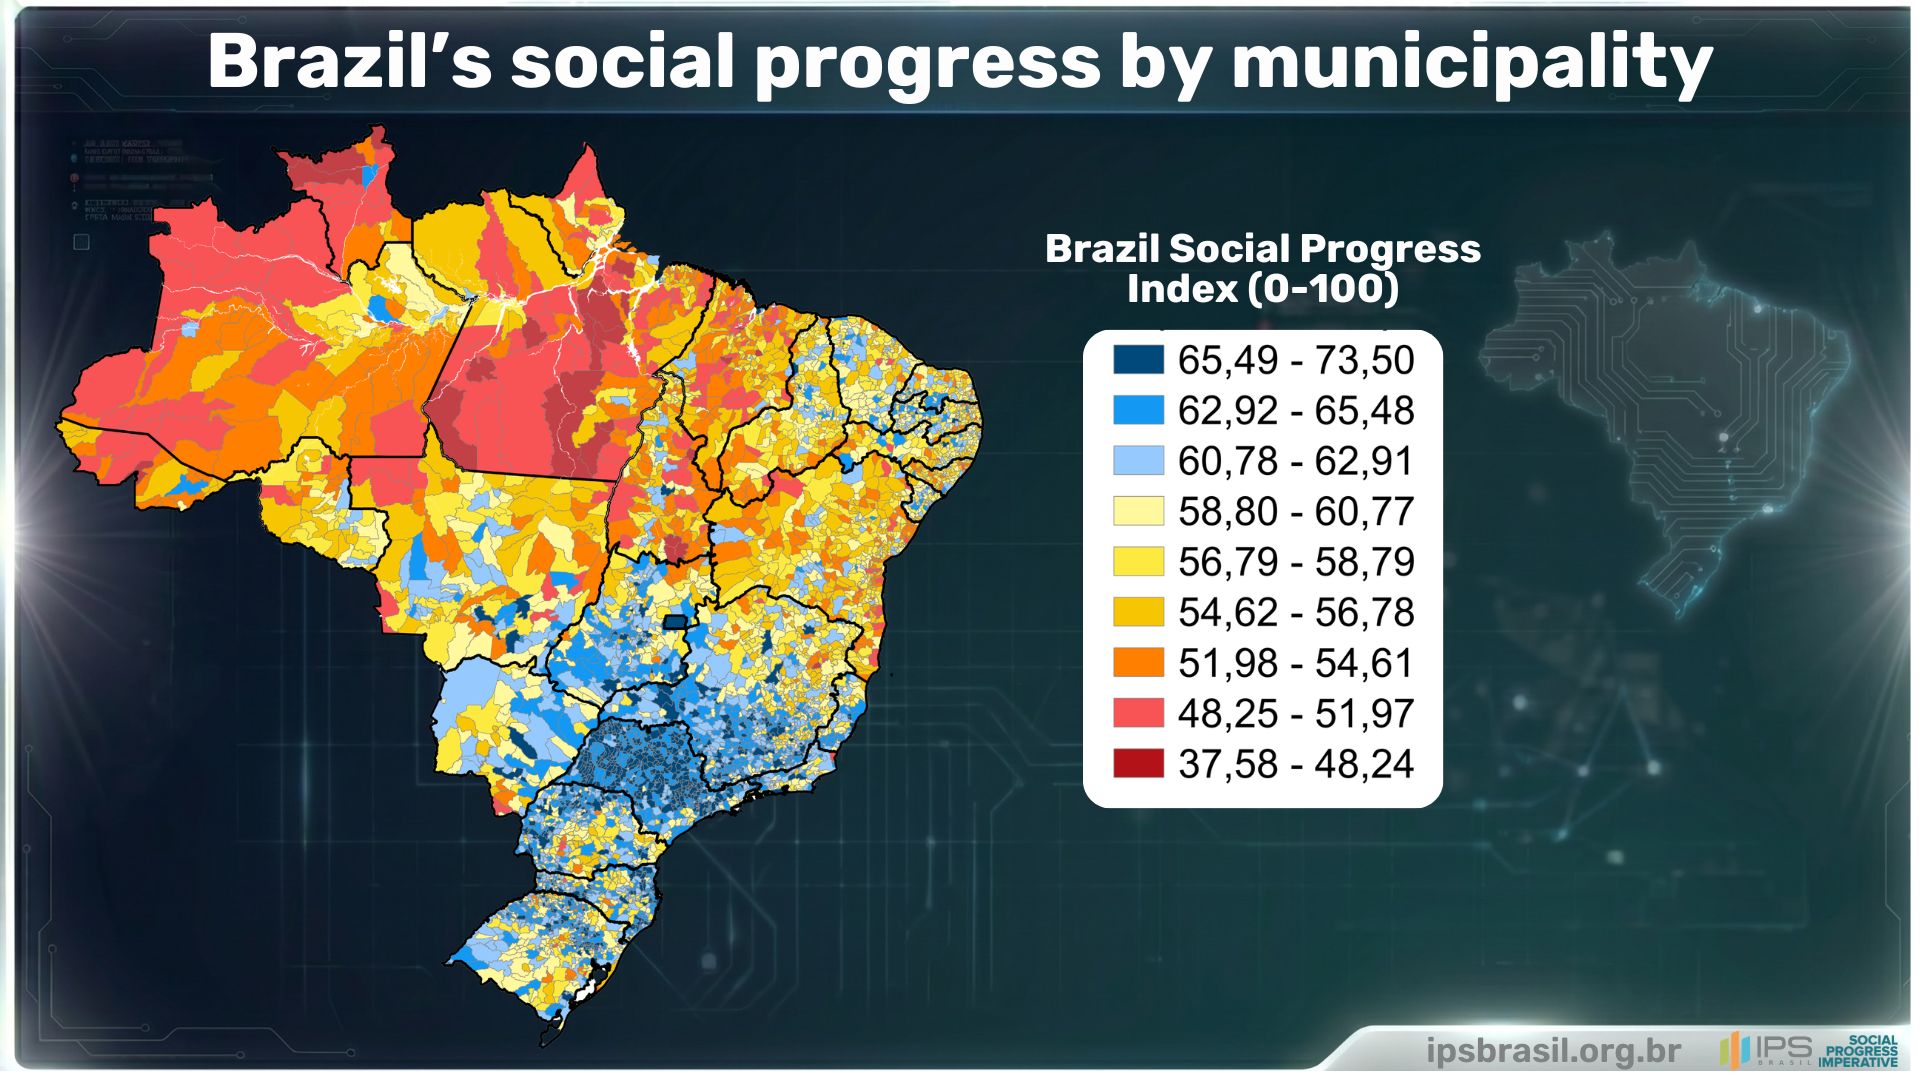
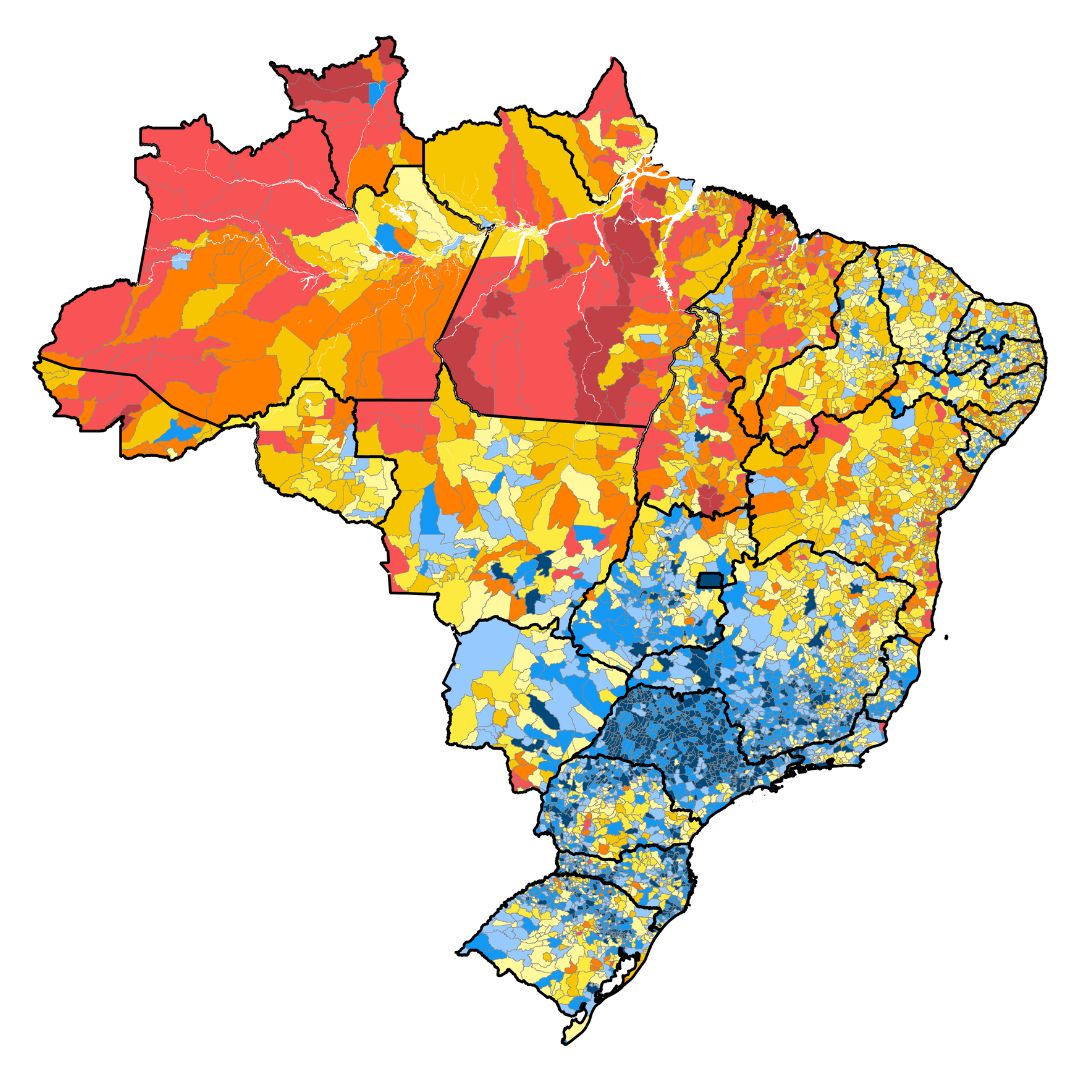
Group 1 displayed in darker blue are the municipalities with the highest scores in social progress. They occupy 3.5% of Brazilian territory, but are home to about 38% of the population and account for approximately 52.3% of the country's GDP.
Click here to see the results in detail.

The top-performing Brazilian states in the ranking of quality of life are: Federal District (#1), São Paulo (#2), Santa Catarina (#3), Paraná (#4) and Minas Gerais (#5). Rondônia (#23), Amapá (#24), Acre (#25), Maranhão (#26) and Pará (#27) are the worst performing states in the country.
See the full list and scores.

The ranking demonstrates a huge disparity between the North region and the Southeast of Brazil where the municipalities with the highest scores are located.
For insights on each municipality, explore the full results.
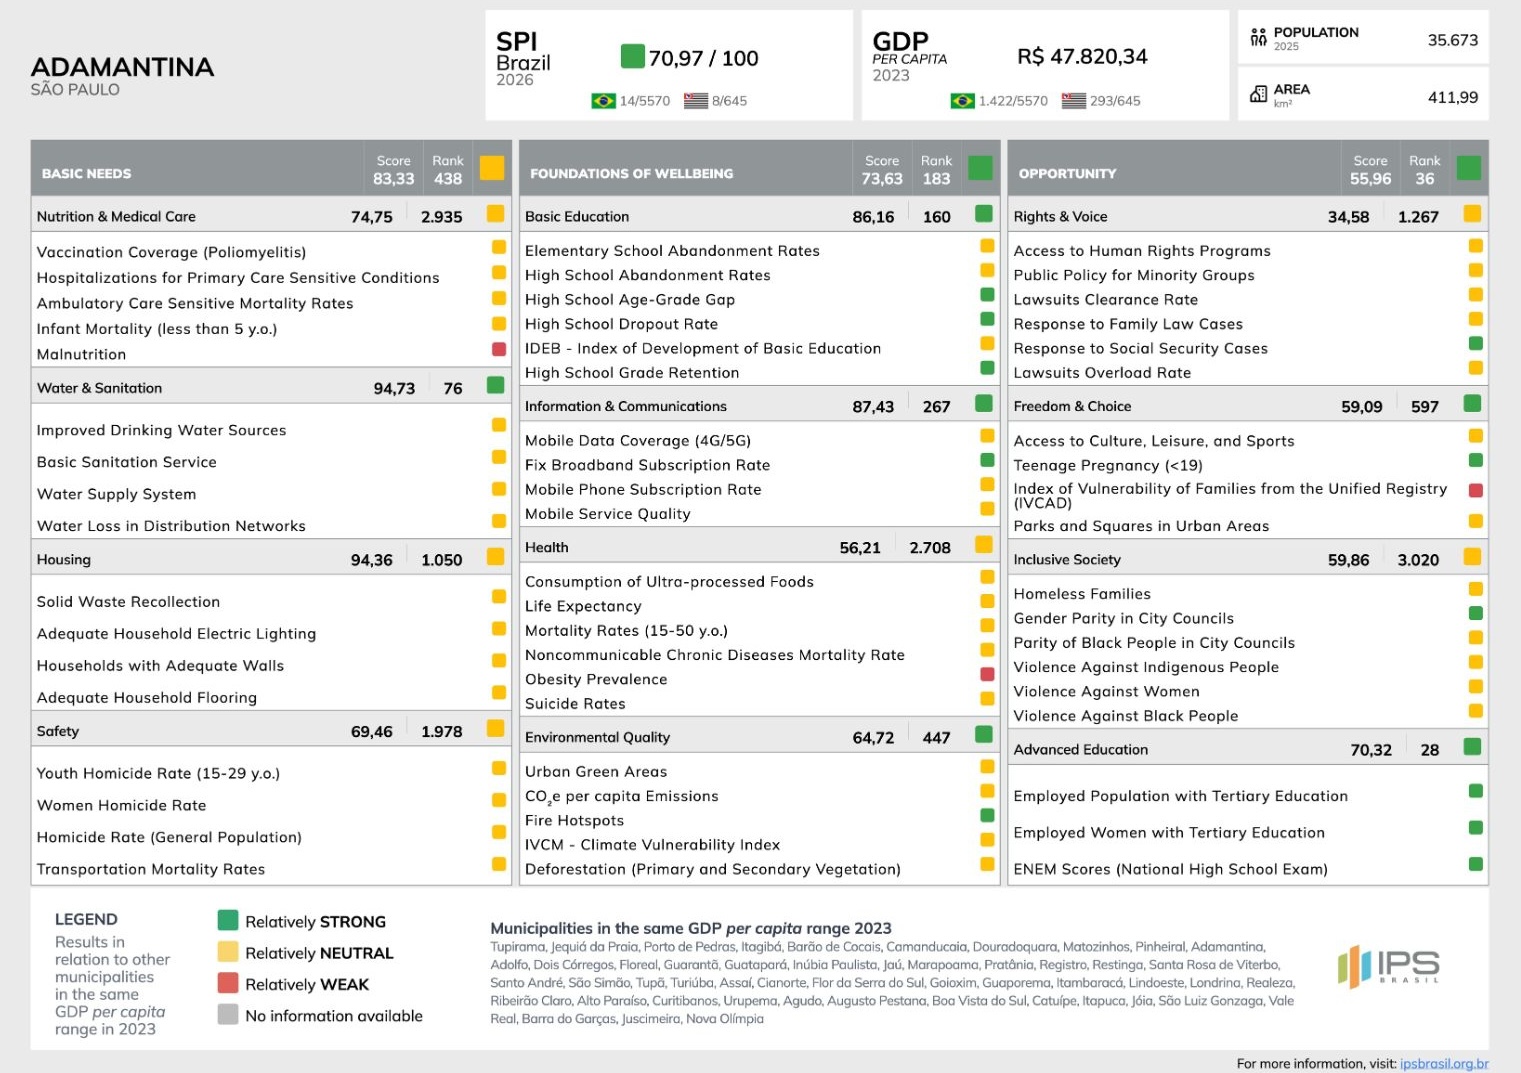
The Brazil Social Progress Index presents a detailed "social diagnostic report" for each municipality, called a scorecard. By using an intuitive, color-coded benchmark system highlighting areas as relatively strong, neutral, or weak, the scorecard evaluates a territory’s performance relative to its economic peers with similar levels of GDP per capita. The scorecards have proven to be incredibly useful because they move beyond rankings, allowing local policymakers and community leaders to pinpoint exactly where a municipality is successfully converting its wealth into quality of life and where critical gaps remain.
According to the Global Social Progress Index, since 2011, the European Union has improved on social progress while the US has declined. However, this is largely due to the US backslide as opposed to the EU making great strides. As we see, social progress has stalled across Europe with the most significant decreases in Austria (-0.77), Lithuania (-0.62), Spain (-0.49), Slovakia (-0.47) and Croatia (-0.41).
In the UK the social progress has declined by 0.39 points since 2011 and it has fallen 8 places in the ranks since 2011 to 21st in 2023. As in the US, the UK decline is largely driven by declining rights and inclusiveness.
The Brazil Social Progress Index presents a detailed "social diagnostic report" for each municipality, called a scorecard. By using an intuitive, color-coded benchmark system highlighting areas as relatively strong, neutral, or weak, the scorecard evaluates a territory’s performance relative to its economic peers with similar levels of GDP per capita. The scorecards have proven to be incredibly useful because they move beyond rankings, allowing local policymakers and community leaders to pinpoint exactly where a municipality is successfully converting its wealth into quality of life and where critical gaps remain.
While Brazil shows improvement across all social progress dimensions from 2024 to 2026, there is still a disparity. The Opportunity dimension lags at 46.82 points, a difference of 27.76 points compared to the country's performance in meeting Basic Needs.
Explore the full rankings, report, and interactive map to better understand where Brazil is making progress and where urgent action is needed.
Group 1 displayed in darker blue are the municipalities with the highest scores in social progress. They occupy 3.5% of Brazilian territory, but are home to about 38% of the population and account for approximately 52.3% of the country's GDP.
Click here to see the results in detail.
The top-performing Brazilian states in the ranking of quality of life are: Federal District (#1), São Paulo (#2), Santa Catarina (#3), Paraná (#4) and Minas Gerais (#5). Rondônia (#23), Amapá (#24), Acre (#25), Maranhão (#26) and Pará (#27) are the worst performing states in the country.
See the full list and scores.
The ranking demonstrates a huge disparity between the North region and the Southeast of Brazil where the municipalities with the highest scores are located.
For insights on each municipality, explore the full results.
The Brazil Social Progress Index presents a detailed "social diagnostic report" for each municipality, called a scorecard. By using an intuitive, color-coded benchmark system highlighting areas as relatively strong, neutral, or weak, the scorecard evaluates a territory’s performance relative to its economic peers with similar levels of GDP per capita. The scorecards have proven to be incredibly useful because they move beyond rankings, allowing local policymakers and community leaders to pinpoint exactly where a municipality is successfully converting its wealth into quality of life and where critical gaps remain.
While Brazil shows improvement across all social progress dimensions from 2024 to 2026, there is still a disparity. The Opportunity dimension lags at 46.82 points, a difference of 27.76 points compared to the country's performance in meeting Basic Needs.
Explore the full rankings, report, and interactive map to better understand where Brazil is making progress and where urgent action is needed.
The Brazil Social Progress Index presents a detailed "social diagnostic report" for each municipality, called a scorecard. By using an intuitive, color-coded benchmark system highlighting areas as relatively strong, neutral, or weak, the scorecard evaluates a territory’s performance relative to its economic peers with similar levels of GDP per capita. The scorecards have proven to be incredibly useful because they move beyond rankings, allowing local policymakers and community leaders to pinpoint exactly where a municipality is successfully converting its wealth into quality of life and where critical gaps remain.
Group 1 displayed in darker blue are the municipalities with the highest scores in social progress. They occupy 3.5% of Brazilian territory, but are home to about 38% of the population and account for approximately 52.3% of the country's GDP.
Click here to see the results in detail.
The top-performing Brazilian states in the ranking of quality of life are: Federal District (#1), São Paulo (#2), Santa Catarina (#3), Paraná (#4) and Minas Gerais (#5). Rondônia (#23), Amapá (#24), Acre (#25), Maranhão (#26) and Pará (#27) are the worst performing states in the country.
See the full list and scores.
The ranking demonstrates a huge disparity between the North region and the Southeast of Brazil where the municipalities with the highest scores are located.
For insights on each municipality, explore the full results.
While Brazil shows improvement across all social progress dimensions from 2024 to 2026, there is still a disparity. The Opportunity dimension lags at 46.82 points, a difference of 27.76 points compared to the country's performance in meeting Basic Needs.
Explore the full rankings, report, and interactive map to better understand where Brazil is making progress and where urgent action is needed.
Group 1 displayed in darker blue are the municipalities with the highest scores in social progress. They occupy 3.5% of Brazilian territory, but are home to about 38% of the population and account for approximately 52.3% of the country's GDP.
Click here to see the results in detail.
The top-performing Brazilian states in the ranking of quality of life are: Federal District (#1), São Paulo (#2), Santa Catarina (#3), Paraná (#4) and Minas Gerais (#5). Rondônia (#23), Amapá (#24), Acre (#25), Maranhão (#26) and Pará (#27) are the worst performing states in the country.
See the full list and scores.
The ranking demonstrates a huge disparity between the North region and the Southeast of Brazil where the municipalities with the highest scores are located.
For insights on each municipality, explore the full results.
The Brazil Social Progress Index presents a detailed "social diagnostic report" for each municipality, called a scorecard. By using an intuitive, color-coded benchmark system highlighting areas as relatively strong, neutral, or weak, the scorecard evaluates a territory’s performance relative to its economic peers with similar levels of GDP per capita. The scorecards have proven to be incredibly useful because they move beyond rankings, allowing local policymakers and community leaders to pinpoint exactly where a municipality is successfully converting its wealth into quality of life and where critical gaps remain.
While Brazil shows improvement across all social progress dimensions from 2024 to 2026, there is still a disparity. The Opportunity dimension lags at 46.82 points, a difference of 27.76 points compared to the country's performance in meeting Basic Needs.
Explore the full rankings, report, and interactive map to better understand where Brazil is making progress and where urgent action is needed.
Group 1 displayed in darker blue are the municipalities with the highest scores in social progress. They occupy 3.5% of Brazilian territory, but are home to about 38% of the population and account for approximately 52.3% of the country's GDP.
Click here to see the results in detail.
The top-performing Brazilian states in the ranking of quality of life are: Federal District (#1), São Paulo (#2), Santa Catarina (#3), Paraná (#4) and Minas Gerais (#5). Rondônia (#23), Amapá (#24), Acre (#25), Maranhão (#26) and Pará (#27) are the worst performing states in the country.
See the full list and scores.
While Brazil shows improvement across all social progress dimensions from 2024 to 2026, there is still a disparity. The Opportunity dimension lags at 46.82 points, a difference of 27.76 points compared to the country's performance in meeting Basic Needs.
Explore the full rankings, report, and interactive map to better understand where Brazil is making progress and where urgent action is needed.
Group 1 displayed in darker blue are the municipalities with the highest scores in social progress. They occupy 3.5% of Brazilian territory, but are home to about 38% of the population and account for approximately 52.3% of the country's GDP.
Click here to see the results in detail.
Group 1 displayed in darker blue are the municipalities with the highest scores in social progress. They occupy 3.5% of Brazilian territory, but are home to about 38% of the population and account for approximately 52.3% of the country's GDP.
Click here to see the results in detail.
Group 1 displayed in darker blue are the municipalities with the highest scores in social progress. They occupy 3.5% of Brazilian territory, but are home to about 38% of the population and account for approximately 52.3% of the country's GDP.
Click here to see the results in detail.
While Brazil shows improvement across all social progress dimensions from 2024 to 2026, there is still a disparity. The Opportunity dimension lags at 46.82 points, a difference of 27.76 points compared to the country's performance in meeting Basic Needs.
Explore the full rankings, report, and interactive map to better understand where Brazil is making progress and where urgent action is needed.
Group 1 displayed in darker blue are the municipalities with the highest scores in social progress. They occupy 3.5% of Brazilian territory, but are home to about 38% of the population and account for approximately 52.3% of the country's GDP.
Click here to see the results in detail.
The top-performing Brazilian states in the ranking of quality of life are: Federal District (#1), São Paulo (#2), Santa Catarina (#3), Paraná (#4) and Minas Gerais (#5). Rondônia (#23), Amapá (#24), Acre (#25), Maranhão (#26) and Pará (#27) are the worst performing states in the country.
See the full list and scores.
The ranking demonstrates a huge disparity between the North region and the Southeast of Brazil where the municipalities with the highest scores are located.
For insights on each municipality, explore the full results.
Solutions to develop high quality products.
While Brazil shows improvement across all social progress dimensions from 2024 to 2026, there is still a disparity. The Opportunity dimension lags at 46.82 points, a difference of 27.76 points compared to the country's performance in meeting Basic Needs.
Explore the full rankings, report, and interactive map to better understand where Brazil is making progress and where urgent action is needed.
Group 1 displayed in darker blue are the municipalities with the highest scores in social progress. They occupy 3.5% of Brazilian territory, but are home to about 38% of the population and account for approximately 52.3% of the country's GDP.
Click here to see the results in detail.
The top-performing Brazilian states in the ranking of quality of life are: Federal District (#1), São Paulo (#2), Santa Catarina (#3), Paraná (#4) and Minas Gerais (#5). Rondônia (#23), Amapá (#24), Acre (#25), Maranhão (#26) and Pará (#27) are the worst performing states in the country.
See the full list and scores.
The ranking demonstrates a huge disparity between the North region and the Southeast of Brazil where the municipalities with the highest scores are located.
For insights on each municipality, explore the full results.
The Brazil Social Progress Index presents a detailed "social diagnostic report" for each municipality, called a scorecard. By using an intuitive, color-coded benchmark system highlighting areas as relatively strong, neutral, or weak, the scorecard evaluates a territory’s performance relative to its economic peers with similar levels of GDP per capita. The scorecards have proven to be incredibly useful because they move beyond rankings, allowing local policymakers and community leaders to pinpoint exactly where a municipality is successfully converting its wealth into quality of life and where critical gaps remain.
In this brief interview, Sofía Ramírez, director of México ¿cómo vamos? highlights six key takeaways from their latest report and the lessons Mexico offers as a diverse country. She also shares how they collaborate with policymakers and leaders across sectors to track and amplify the impact of their work.
Explore the full results and learn more about the six main challenges Mexico faces in social progress.
Melissa Wilm from IPS Brasil shares how one of the world’s most diverse and complex nations is using data to spark high-impact collaborations. We analyze four impact cases that have improved the quality of life for Brazilian communities in collaboration with various stakeholders including governments and community advocates.
Melissa Wilm from IPS Brasil shares how one of the world’s most diverse and complex nations is using data to spark high-impact collaborations. We analyze four impact cases that have improved the quality of life for Brazilian communities in collaboration with various stakeholders including governments and community advocates.
.gif)


Learn about the impact of the Social Progress Index Amazônia across municipalities in the Amazon region, showcasing how data-driven insights have empowered local leaders, promoted collaboration, and driven meaningful social progress in health, education, and wellbeing.

Use this interactive map to guide policies, shape local investments, and ensure no one is left behind. With the data insightsfrom every municipality and state, leaders and decisionmakers pinpoint challenges, allocate resources more effectively, and drive real social impact in Brazil.
The India Dialogue, hosted at Stanford University, brought together leaders from various sectors to share insights on how India can tackle social challenges and enhance policymaking. The plan of action presented at the event focuses on innovation, social progress, and competitiveness as key pillars.
The Social Progress Index for all 384 metropolitan areas was built in collaboration between the Initiative for a Competitive Inner City and the Social Progress Imperative. The index measures how the metropolitan areas have advanced or regressed in social progress for 2018 and 2023.
.jpg)
The Ukraine Refugee Pulse tells the story of Ukrainian refugees living in Poland. We gained insights into their living conditions and shared them to see how the government and other organizations can address their needs.

Ready to advance social progress in your community?
