The EU Regional Health Equity Map  


Offering an overview of health-related inequalities and the social determinants of health across all 242 NUTS2 regions of the European Union.

It provides actionable insights for regional and health policymakers, helping to inform targeted interventions and to design more effective strategies for improving health and well-being.
The first-ever map of health inequality across the NUTS2 regions of the European Union.
Putting the wellbeing of the EU citizens at the heart of decision-making by equipping leaders with data that provides a clear picture of the needs and the priorities of the communities in which they operate and serve.
About the Map
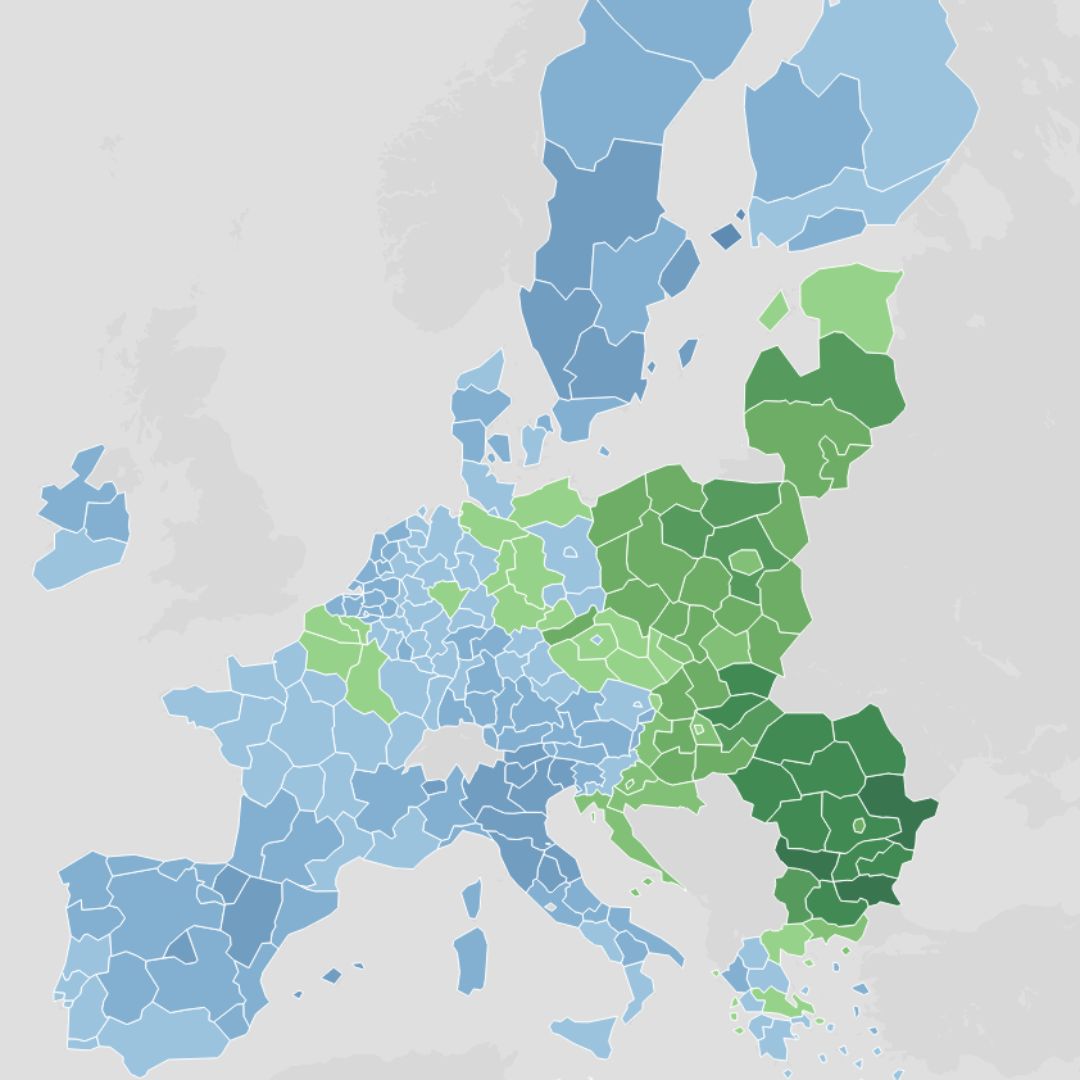
The map evaluates the health realities of EU citizens at a granular (NUTS2) level using health equity and life-course cycle frameworks.

Health equity is assessed through three complementary lenses: the enabling environment, health outcomes, and health perceptions.

The life-course framework compares regional mortality outcomes separately for different age groups.

To better understand the social determinants of health across EU regions, insights from both frameworks are cross-analyzed with indicators from the EU Regional Social Progress Index and the EU Regional Competitiveness Index.

Why is this tool unique?
Granular, regional lens  
Tracks health equity at NUTS2 level across the EU, revealing disparities that national averages hide.

Two complementary frameworks in one tool  
Presents a Health Equity Framework (enabling environment, outcomes, perceptions) alongside a Life-Course Framework (mortality across four age groups).

Links health to root causes  
Connects health patterns to social determinants, benchmarking against the EU Regional Social Progress Index and the EU RegionalCompetitiveness Index.

Comparable over time  
Enables clear trend narratives (e.g., 2010–2023 for health equity pillars; early 2010s vs early 2020s for life-course), supporting “progress vs convergence” assessment.

Action-oriented design  
Built to support policy discussions with clear typologies (e.g.,capacity–access mismatches; multi-dimensional disadvantage) rather than only rankings.

Turns “hard-to-use” data into decision-ready evidence  
In an area where data are often fragmented and difficult to interpret, the initiative provides a consistent, comparable, and user-friendly structure for regional health equity assessment.
What is the main contribution and value for policymakers?
• A shared evidence foundation for place-based policy  
Offers a consistent, EU-wide way to pinpoint where health inequities are concentrated and the dimension in which they are most pronounced (capacity, outcomes, or lived access).

• Moves beyond ‘more healthcare’ as the default answer  
Shows that system capacity does not automatically translate into better outcomes or lower unmet needs—highlighting the importance of affordability, accessibility, and user experience.

• Life-course targeting  
Demonstrates that inequalities widen with age, supporting age-specific policy packages (early-life protection, youth risk prevention, working-age prevention,healthy ageing).

• Cross-sector policy relevance  
Shows that social progress aligns strongly with outcomes, mortality, and access perceptions, while the link to capacity is weaker—supporting “health in all policies” and cohesion-oriented action.

• Practical tool for communication and accountability  
Produces clear, visual outputs (maps, trends, scatterplots) that can inform policymakers briefings, regional dialogues, and monitoring over time.

Key Insights

Results

For the best experience and to fully explore the data visualizations, we recommend viewing this page on a computer.
Use the blue menu bar to switch between frameworks and dashboards, then use the grey menu bar to navigate specific tabs within each view by clicking the side arrows. Customize your insights by selecting an indicator, country, region, or year from the filters. For the best experience, view these visualizations on a computer. At the bottom right, you can download the visualizations in the format of your choice.

Resources

Key Findings
Explore the map's key findings to reveal the true state of health equity across EU regions. By pinpointing where progress is lagging and where potential is greatest, these takeaways serve as a roadmap for policymakers and stakeholders.
Methodology
The EU Regional Health Equity Map is built on a rigorous framework. This methodology summary outlines the approach to measuring the map, covering the Health Equity Framework, the Life Course Framework, and the Social Determinants of Health Analysis.